
Wednesday, January 15, 2020
Is This The Start Of A New Offshore Oil & Gas Boom?
In
retrospect, 2019 was another strong year for offshore exploration and
production companies. Free cash flow remained strong and telltale signs have
emerged that we are entering a new offshore investment cycle. This trend was
perhaps illustrated most profoundly by the rising swell of offshore project
approval activity by operators in 2019. Globally, the amount of oil and gas
resources approved for development last year surpassed 20 billion barrels of
oil equivalent (boe), the highest level seen since 2011.
A
quick look at free cash flow (FCF) levels in recent years confirms that 2019
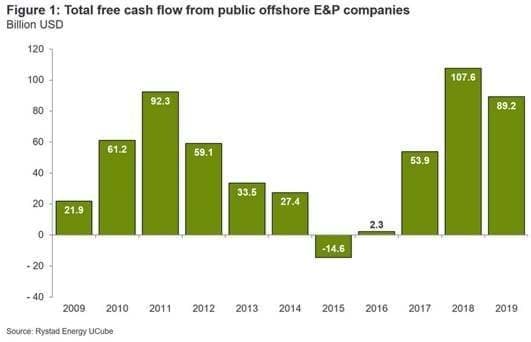
was a strong year for the offshore sector. Figure 1 shows the total offshore
FCF from all public E&P companies globally. This shows that 2019 was the
third best year on record, with FCF reaching nearly $90 billion. This
represented a slight reduction compared to 2018, but compares very favorably
with the previous investment cycle from 2010 to 2014. This shows that the cash
flow situation for offshore players is very robust, underlining the point that
E&Ps have enough cash in hand to invest in new projects after several years
of restrained capital expenditure.
This
trend is clearly reflected when looking at project approval activity in 2019.
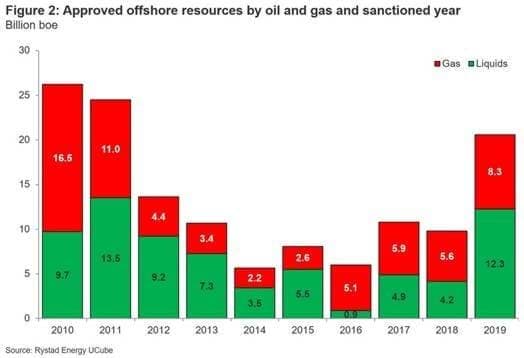
Figure 2 provides an overview of total approved offshore resources each year
over the past decade, split by liquids and gas. Last year saw the approval of
12.3 billion barrels of liquids projects, along with 8.3 billion boe of new gas
projects, thus bringing total approved resources to 20.6 billion boe. Given
that the total amount of offshore production in 2019 was 10.1 billion barrels
of liquids and 7.0 billion boe of gas, this implies a replacement ratio of 1.2
for both oil and gas. The approved volumes in 2019 were 110% higher than 2018,
and the highest number since 2011.
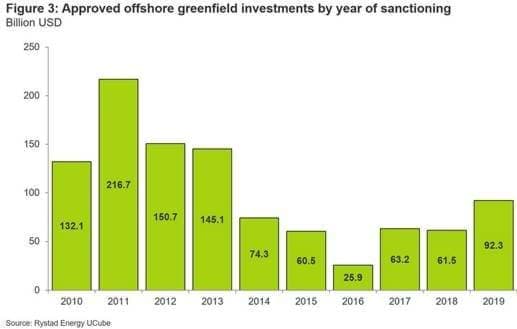
Figure
3 shows approved offshore greenfield investments (designated for the
development of new projects) by year of sanctioning. Once again, a strong
increase in activity is seen in 2019. Total greenfield investments approved
last year increased by 50% versus 2018. This significant rise in approved
resources and investments was driven by several very large developments that
were approved last year, such as the massive Marjan and Berri expansion
projects in Saudi Arabia. These projects feature very large resource bases and
offer lower greenfield investment cost per boe compared to smaller projects.
Measured in dollars, comparing last year’s investment levels with the years
during the previous investment cycle from 2010 through 2014 does not tell the
whole story, as cost levels within the E&P industry have come down
significantly since 2014.
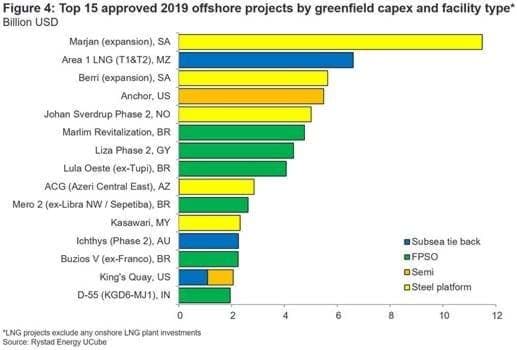
Figure
4 shows the 15 largest offshore projects approved last year, measured by total
greenfield capex. The expansion phase of Saudi Aramco’s Marjan field in Saudi
Arabia was by far the largest project approved last year, with close to $12
billion in investments. The project aims to add 24 new offshore platforms to
handle initial oil and gas processing and water injection. These platforms will
tie into the onshore expansion of the Tanajib oil facilities, as well as other
newly built onshore gas facilities. The second largest project on the list is
the first phase of Total’s Area 1 development in Mozambique. This gas project
will be developed as a subsea tieback to an onshore LNG plant. Chevron’s Anchor
field development in the US is the largest project within the Atlantic region,
just ahead of the second phase of Equinor’s Johan Sverdrup field in Norway.
Unsurprisingly,
this rising tide of approval activity has carried with it an increase in
offshore investments in 2019. Total offshore capex grew by 5% versus 2018, with
a 7% rise in deepwater spending and a 3% boost in investments on the
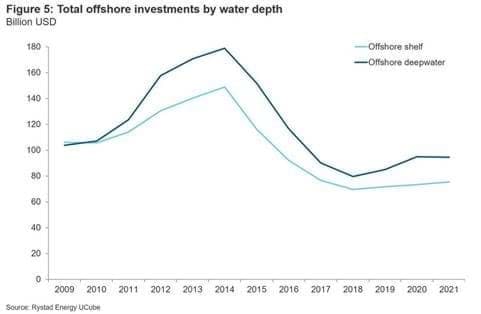
continental shelf. For 2020, offshore
investments are on track to grow 8%, with deepwater up 12% and shelf spending
up 2% (see Figure 5). This illustrates that a new offshore investment cycle is
in the making.